© 2008 Rasmus ehf
and Jóhann Ísak
© 2008 Rasmus ehf |
Trig functions |
We will now look at the graphs of trig functions starting with the function f(v°) = sin v°. The angle v° is measured from the x– axis and we look at what happens as the angle v gets bigger.

We make a table of values:
We have already calculated sin 30° and sin 60° by using the fact that in triangles with angles 30°, 60° and 90°, the side opposite the 30° angle is half the length of the hypotenuse. This means we can easily find values of sin v° at 30° intervals. We can also use the sin x function in the calculator or the spread sheet.
|
v° |
f(v°) = sin v° |
|
| 0° | 0 | 0 |
| 30° |
1/2 |
0.5 |
| 60° |
|
0.866 |
| 90° | 1 | 1 |
| 120° |
|
0.866 |
| 150° | 1/2 | 0.5 |
| 180° | 0 | 0 |
| 210° |
-1/2 |
-0.5 |
| 240° |
- |
-0.866 |
| 270° | -1 | -1 |
| 300° | - |
-0.866 |
| 330° | -1/2 | -0.5 |
| 360° | 0 | 0 |
Now we draw a graph from these values, marking the angles v° on the x – axis and sin v° on the y – axis .

The result is the Sine wave, a well known phenomena in physics and the natural sciences. The problem is that Sine waves in nature are functions of time and length, not degrees, as we have used here.
To solve this problem a new way of measuring angles is used. This unit for measuring an angle is called a Radian and is found by measuring the length of the arc of the unit circle between the radius that forms one side of the angle and the x – axis.
One radian is the size of an angle that sweeps out an arc of length one unit on the unit circle ( see diagram ).

Imagine putting a wire of the same length as the radius, at the point on the x – axis where x = 1. Now bend the wire round the circumference of the circle. The angle at the centre of the circle that spans this arc is one radian. The unit is sometimes called rad. Can you see from the diagram that 1 rad is slightly less than 60°?.
But how do we find the exact connection between degrees and radians? How can we change between degrees and radians?
We do this by noting that the circumference of a
circle is 2∙r∙![]() or 2
or 2![]() in this case where r = 1.
in this case where r = 1.
In other words the unit circle, which spans an
angle of 360°, has a circumference of 2![]() .
.
This leads to the following result:
2 |
To change from radians to degrees we multiply by 180/ |
To change from degrees to radians we multiply by |
We’ll now look at the Sine wave in our usual x – y coordinate system.
To
do this we need to change the angles from degrees to radians by multiplying by ![]() /180 and cancelling as much as possible.
/180 and cancelling as much as possible.

Now we put the angles in radians as values on the x – axis. We’ll leave the degrees in as well for comparison.

Calculate the number of degrees in one radian.
To do this we have to
multiply by 180/![]() , using the value for
, using the value for ![]() on the calculator ≈ 3.14
on the calculator ≈ 3.14
1∙180°/![]() ≈ 57.3°
≈ 57.3°
Change 5![]() /4 radians to degrees.
/4 radians to degrees.
Again we can multiply by 180/![]() or
use the fact that p radians is the same as 180°. So we can simply
replace
or
use the fact that p radians is the same as 180°. So we can simply
replace ![]() by
180°.
by
180°.
5![]() /4 = 5∙180/4 = 225°.
/4 = 5∙180/4 = 225°.

It’s very easy to draw graphs of trig functions if a graphical calculator is used.
The following describes how to do this with a CASIO calculator. The first thing to do is to decide in what units the angle is to be measured. The calculator offers three possibilities. Degrees, radians and grads.
Grads are similar to degrees but with 400 grads in a circle rather than 360°.
The units are changed by choosing the graph on the menu and then pressing
„Shift and Set Up“.
The window that opens offers various possibilities, but for the moment we are only concerned with angle measurement. Use the arrows on the calculator and go to
„Angle“.
The following three choices can be made:
„Deg, Rad, Gra“
By pressing F1, F2 or F3.
We choose either “Deg”(degrees) or ”Rad” (radians) and press “exe”.
Next we choose the scale on the x axis by pressing
Shift og View Window (F3) and choosing “trig” (F2)
Now we are ready to draw the graph.

For example the graph of y = sin x

Now we can draw the graph by pressing F6 .
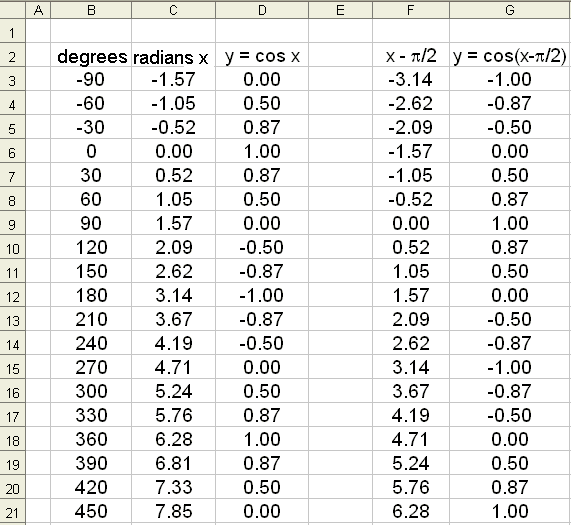
We will now see how Excel can be used to draw some trig graphs. First we will draw the graph of f(x) = cos x, for x on the interval −90° to 450° and find values of cos x at 30° intervals. We start by entering −90 in the column for angles (B3) then −60 and so on. ( It’s best to do this by copying down)
Excel uses radians so we use
column C for the radian values of the angles. This is done by multiplying by ![]() /180. The formula in C3 will be =B3*Pi()/180.
The formula is then copied down the C column.
/180. The formula in C3 will be =B3*Pi()/180.
The formula is then copied down the C column.
We put the formula for the cosine function in column D. The formula in D3 will be =cos(C3) . Again it can be copied down the column.
The graph is drawn by blocking columns B and D, choosing the graphing tool and then XY (scatter). The appearance of the graph can be changed by right clicking with the mouse. The Excel spread sheet will look as follows:

The graph y = cos x looks like this:

We see that the cosine graph is exactly the same as the
sine graph if it is moved by by ![]() /2
(90°) to the right.
/2
(90°) to the right.
See what happens if we
subtract ![]() /2 from the values in column C and find the cosine of the new values.
(see columns F– G), then draw the graph of y = cos(x −
/2 from the values in column C and find the cosine of the new values.
(see columns F– G), then draw the graph of y = cos(x − ![]() /2).
/2).

In this way we have translated the cosine graph
by![]() /2 (90°) to the right and the
result is the graph of the sine function.
/2 (90°) to the right and the
result is the graph of the sine function.
This shows that the following rule holds:
sin x = cos(x − ![]() /2)
/2)
The following general rule is true:
The graphs of the trig functions can be translated to the right by subtracting a constant value from the variable x.
The graphs of y = sin(x − a) and y = cos(x
− a) are the same as the graphs of y = sin x and |
If a is negative we get two negatives and are therefore adding to the x value. This is equivalent to a translation to the left. We can also say that the graph y = cos(x + b) is the same as the graph of y = cos x translated b units to the left.
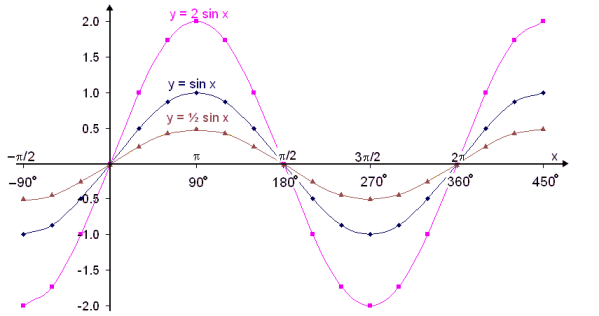
We will now use Excel to see the effect that multiplying the sine function by a constant number has on the graph.
We’ll look at the graphs
of y = sin x, y = 2∙sin x and
y = ½∙sin x
The graphs are as follows:

As might have been expected the amplitude of the wave doubles when we multiply 2. The amplitude is the maximum height of the wave above the line of symmetry (in this case the x – axis). If we multiply by a number less than one the amplitude is less than that of the original sine wave.
If we multiply by a negative number the wave is reflected in the x – axis (turns upside down).
Now let’s see what effect multiplying x by a constant number has on the graphs. We’ll compare the graphs of y = sin x, y = sin 2x and y = sin x/2.

We see that multiplying x by a constant affects how often the wave repeats itself. In other words it affects the period or wave length of the graph.
The basic Sine function has
a period or wave length of 2![]() , or 360°. This means that
it repeats itself at 2
, or 360°. This means that
it repeats itself at 2![]() intervals. This is the length on the x axis from the start of one wave
to the start of the next.
intervals. This is the length on the x axis from the start of one wave
to the start of the next.
The period of the function
f(x) = sin 2x is half of the period of the original function, that is ![]() . Or we can say the number of waves over a given interval on the x axis
has doubled.
. Or we can say the number of waves over a given interval on the x axis
has doubled.
The period of the function f(x) = sin x/2 is double the period of the original function, that is 4![]() .
This time the number of waves over a given interval has decreased by half.
.
This time the number of waves over a given interval has decreased by half.
In general we can show that
if x is multiplied by the constant b then the period of the wave will be 2![]() /b.
/b.
Here is a summary of the results found in the above examples.
Given the function f(x) = c∙sin b∙(x − a) + e a is the translation of the wave to the right if a is positive, to the left if a is negative. The period or wave length is 2 c is the amplitude of the wave. e is the vertical translation of the wave. Up if e > 0, down if e < 0. |
Look at the function f(x) =
3∙sin 2(x − ![]() /4) + 3 and compare to the basic function f(x) = sin x.
/4) + 3 and compare to the basic function f(x) = sin x.
a = p/4, which means that the wave has been translated by ![]() /4 (45°) to the right .
/4 (45°) to the right .
e = 3 so the wave has been
translated 3 units vertically up.
b = 2 so the period is 2![]() /2 =
/2 = ![]() .
.
c = 3 so the amplitude of
the wave is 3.
Now we’ll use this information to draw the graph.

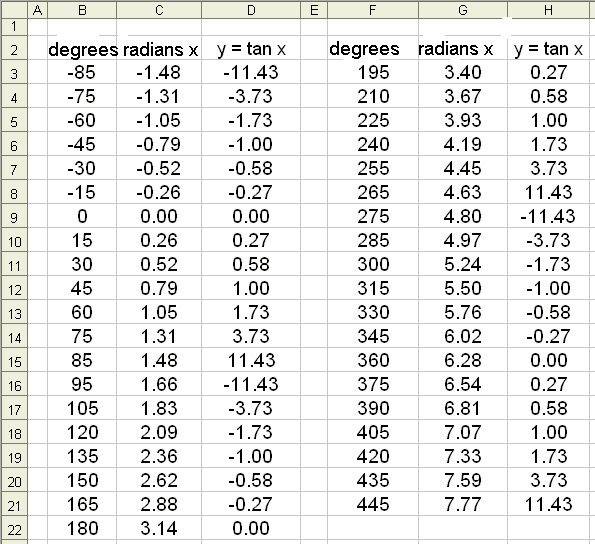
Draw the graph of f(x) = tan x.
We know that tan x = sin x/cos x so it doesn’t exist when cos x = 0. This means that vertical asymptotes occur whenever cos x
= 0, that is when x = ![]() /2
(90°), 3
/2
(90°), 3![]() /2
and so on at intervals of
/2
and so on at intervals of ![]() units (180°). The following is a
table of values from Excel. We have left out the values of x where tan x does
not exist, that is where the asymptotes are.
units (180°). The following is a
table of values from Excel. We have left out the values of x where tan x does
not exist, that is where the asymptotes are.


The tangent function is always increasing ( goes up as we move to the right ).
It is steep near to the asymptote in x = −![]() /2 (−90°).
/2 (−90°).
The function takes the value
−1 when x = −![]() /4 (−45°) and 0 when
/4 (−45°) and 0 when
x = 0. It then takes the value 1 in x = ![]() /4 (45°) and rises rapidly as
x gets near to the value x =
/4 (45°) and rises rapidly as
x gets near to the value x = ![]() /2 (90°) where there is another asymptote. This curve repeats itself at
intervals of
/2 (90°) where there is another asymptote. This curve repeats itself at
intervals of ![]() or 180° which is the period
of the function.
or 180° which is the period
of the function.
Try Quiz 3
on Trig functions.
Remember to use the checklist to keep track of your work.