Functions I
| © 2007 Rasmus ehf and Jóhann Ísak |
Functions I |
Lesson 1
Functions and graphs
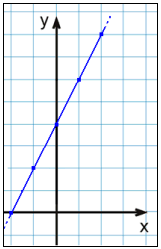
We have the equation y = 2x + 4.
First we make a table of values calculating the y values from the x values we have chosen. When we plot these points in a coordinate system we see they lie on a straight line. We join the points together.
|
 |
This is very easy to do using a graphical calculator. If we have a Casio we choose TABLE in the Menu.


We then write 2x + 4 in the Table function menu that opens. Y1 = 2x + 4 is now on the screen
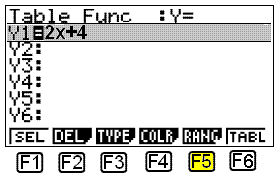
We now have to decide what x values we want to use. To do this we choose RANGE by pressing F5. The following screen appears:
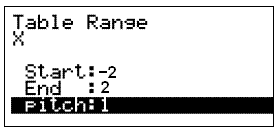
We choose to start with −2 and end with 2. Pitch tells us the steps we want to raise x by. In our case we will leave it as 1 and press EXE.
The following set of actions accomplishes this:
![]()
This takes us back to the previous screen where we choose TABLE by pressing F6. The table of values then appears.
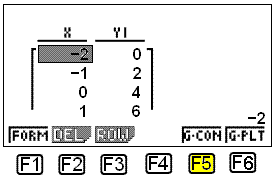
We can draw the graph by choosing G-CON ( F5 ).
It’s also possible to use the program EXCEL to make the table of values and draw the graph.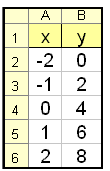
In EXCEL we enter the numbers −2 and −1 in cells A2 and A3 (see the EXCEL table above), we can automatically fill the rest of column A by blocking A2 and A3 then copying down. The formula in B2 is =2×A2 + 4 which is copied down.
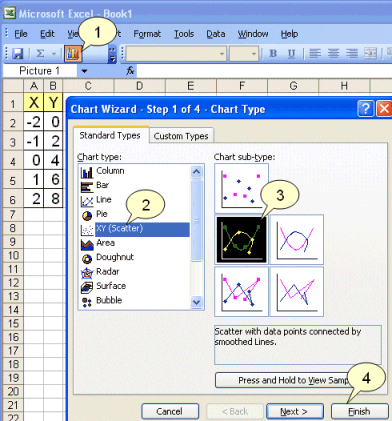
We can draw the graph by blocking the numbers in the two columns then pressing the graphing button (1). We choose “xy-scatter“ (2) and then choose one of the connected graphs (3) before pressing finish (4). We can then make any changes to the appearance of the graph by pointing the mouse to the item we wish to change and pressing the right mouse button.
Now lets look at some more examples.
Example 2
Make a table of values and draw the following graphs
| Graph y = x | ||
| x | y = x | 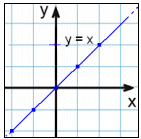 |
| -2 | -2 | |
| -1 | -1 | |
| 0 | 0 | |
| 1 | 1 | |
| 2 | 2 | |
| Graph y = 2 | ||
| x | y = 2 | 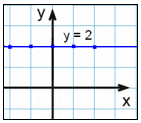 |
| -2 | 2 | |
| -1 | 2 | |
| 0 | 2 | |
| 1 | 2 | |
| 2 | 2 | |
| Graph y = x2 | ||
| x | y = 2 | 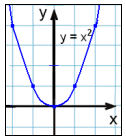 |
| -2 | 4 | |
| -1 | 1 | |
| 0 | 0 | |
| 1 | 1 | |
| 2 | 4 | |
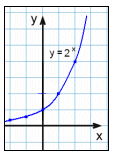
| Graph y = 2x | ||
| x | y = 2x |
 |
| -2 | ||
| -1 | ||
| 0 | 1 | |
| 1 | 2 | |
| 2 | 4 | |
We will now look at some further examples that can’t be dealt with in the same way. In these examples the formula is not written as y =..... and therefore we can’t use the table function in our calculator.
Example 3
x = 2
The only condition here is that x takes the value 2. When we make a table of values we must always have x equal to 2. y can take any value, we have chosen−2, −1, 0, 1 og 2. Here you can see our table of values.
| Graph x = 2 | ||
| x = 2 | y | 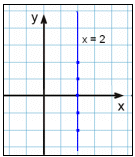 |
| 2 | -2 | |
| 2 | -1 | |
| 2 | 0 | |
| 2 | 1 | |
| 2 | 2 | |
The result is a vertical line through the point 2 on the x axis.
Example 4
Next let’s examine the relationship y2 = x.
When we solve this equation for y we get two answers.
y = ±In other words there are two values of y for each x that we choose. Also we are limited to choosing only positive values for x as we can’t take the square root of a negative number. Below you can see the table of values and the graph.
| Graph
y = ± |
||
| x | y | 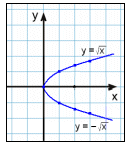 |
| -1 | Not available | |
| 0 | 0 | |
| 1 | ±1 | |
| 2 | ± |
|
| 3 | ± |
|
Example 5
Now look at the equation x2 + y2 = 4.
Solving for y:
x2 + y2 = 4
y2 = 4 − x2
![]()
Again we get two y values for each x value that we choose. We also find that we can’t choose any x values outside the interval [−2, 2] because then we get a negative number under the square root.
The table of values and graph are shown below.
|
Graph |
||
| x | 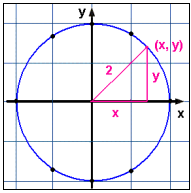 |
|
| -2 | 0 | |
| -1 | ± |
|
| 0 | ±2 | |
| 1 | ± |
|
| 2 | 0 | |
When we plot the points we see that they all lie on a circle with it’s centre at the origin (0, 0) . The radius of the circle is 2 units.
This result is easily understood because
x2 + y2
= 4 is really Pythagoras’ rule for a right angled triangle with a hypotenuse
of length 2 and the other sides og length x and y.These examples show that some
equations that give a rule connecting x and y have only one y value for each x
that we choose and some equations have more than one y for each x.
Equations that connect one y with one x are very important in the sciences and are called FUNCTIONS. We say that “y is a function of x” and write y = f(x) . We read this as “y equals f of x”
When we look at graphs of equations that are functions we see that vertical lines never cut the graph more than once.We see this if we look at the graphs in the examples we have already worked through.
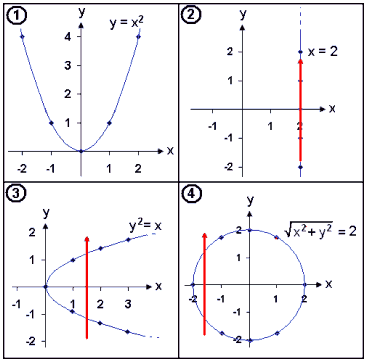
The red vertical line cuts graphs 2, 3 and 4 in two or more places showing us that these are not the graphs of functions.
In example 1 any vertical line we
draw cuts the graph only once. This is the graph of the function with equation y
= x2 .
As well as writing this equation as y = x2 we can write it as f(x) = x2 where y = f(x) .We use f(x) instead of y to show that the value of y depends on the value of x “ is a function of x”.
In this example, if we choose x = 2 then we can calculate y by the formula y = 22 = 4.
In function language we say that f of 2 equals 4.
Using the function notation we can write f(2) = 22 = 4.
Example 6
| Given the function |
|
Find f(0), f(1) and f(3) |
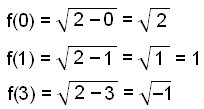
We put the values 0, 1 and 3 into the equation instead of x and work out the value of the function ( y value ) in each case.
 |
|
| This is impossible |
We can put letters as well as numbers into functions.
If f(x) = x3 + x2 then for example:
f(a) = a3 + a2
f(a2) = a6 + a4
f(a+1) = (a+1)3 + (a+1)2.
Example 7
Given the function f(x) = x2, find f(a), f(2a), f(a+1) and f(a+b).
f(a) = a2
f(2a) = 4a2
f(a+1) = (a+1)2 = a2 + 2a + 1
f(a+b) = (a+b)2 = a2 + 2ab + b2
Try Quiz 1 on Functions I.
Remember to use the checklist to keep track of your work.