Functions I
| © 2007 Rasmus ehf and Jóhann Ísak |
Functions I |
Lesson 4
Rational functions
Rational functions have the following form:
| or |
Where f(x) and g(x) are both polynomials and the denominator, g(x) has a degree of at least one ( contains an x ).
We will now look at some examples of rational functions and their graphs.
Example 1
First look at
![]()
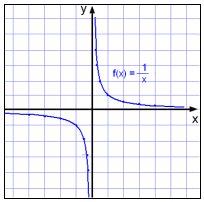
If we start making a table of values, we see at once that x cannot take the value 0 as that would mean dividing by 0.
As x gets nearer and nearer to the value 0 but remains positive ( x= 0.1 , x = 0.01 and so on..)
we see that the function value
As x gets nearer and nearer to 0 but is negative ( x = −0.1, x =− 0.01 and so on..).
The function value takes on a bigger and bigger negative value ( x = −0.01 gives us y= −100).
The graph of the function appears to be almost parallel to the y axis near to where x is 0
When this happens the function is said to have a vertical asymptote.
The equation of the asymptote is x = 0.
Example 2
Next we will examine the function
![]()
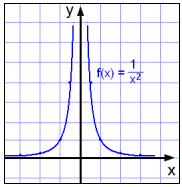
We see that the value of the function gets bigger and bigger as x approaches 0 from the right ( x > 0 ) and from the left ( x < 0 )
We also notice that the graph cuts neither the x axis nor the y axis.
We can try to calculate these points of intersection and see what happens.
We find where the graph intersects the y axis by calculating f(0), as the x coordinate of all points on the y axis is 0.

To calculate this we have to divide by 0, which is impossible.
To find where the graph intersects the x axis we have to solve the equation f(x) = 0 or y = 0 because all points on the x axis have the y coordinate 0.
| = 0 |
1 = 0×x2
Again we get an equation that cannot be solved. We can therefore conclude that the graph does not intersect the coordinate axes.
Example 3
Look at the function
![]()
And calculate where the graph intersects the axes.
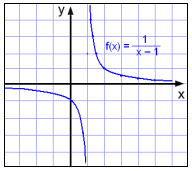
If x = 1 we will be dividing by 0 therefore x ≠ 1 . As x gets nearer and nearer to 1 the y - value gets bigger and bigger, positive if x>1 and negative if x<1.
This time the graph appears to lie close to
the line through
x = 1, going up when x > 1 and
down when x < 1.
To find where the graph intersects the y axis we calculate f(0), as x = 0 on the y axis.

To find where the graph intersects the x axis we solve the equation f(x) = 0 or y = 0 as all points on the x axis have y = 0.

1 = 0×(x − 1) = 0
Again we get an equation that has no solution so we conclude that the graph does not intersect the x axis.
Example 4
Look at the function
![]()
And find any points of intersection with the coordinate axes.
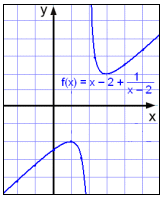
We see that x ≠ 2 as then we would have 0 in the denominator. As x approaches 2 from the right the function value gets bigger and bigger and the graph goes up. As x approaches 2 from the left the function takes a bigger and bigger negative value and the graph goes way down.
So the graph has a
vertical asymptote x = 2.
The graph crosses the y axis when x = 0

The graph crosses the y axis
when f(x)
= 0. We have to solve
the equation:
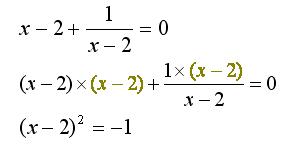 |
When we multiply through by (x - 2) we get an equation that has no solution. |
As the equation f(x) = 0 has no solution the graph does not intersect the x-axis.
The above examples show that a rational function nearly always has a vertical asymptote at the point where the denominator is zero. (The only exceptions are when we can factorise the fraction and cancel out the denominator). The function can be calculated for all other values of x.
Example 5
Finally we will investigate the function

finding the vertical asymptote and the points where the graph intersects the x and y axes.
First consider for what x values we cannot calculate f(x). The denominator is zero when x − 1 = 0, i.e. when x = 1.
The vertical asymptote is
where x = 1 and the function is valid for all values of x except x = 1. Using
Set Notation we can write
{xÎR| x ¹ 1} or R \ {1}
Next find the y intercept by calculating f(0).
f(0) = (0 − 0)/(0 − 1) = 0
The graph intersects the y axis in (0, 0).
To find where the graph intersects the x axis we have to solve the equation f(x) = 0.

x2 − 2x = 0∙(x − 1) = 0
x(x − 2) = 0
x = 0 or 2
The graph intersects the x axis where x = 0 and x = 2.
Try Quiz 4 on Functions I.
Remember to use the checklist to keep track of your work.