© 2009 Rasmus ehf and Jóhann Ísak
|
© 2009 Rasmus ehf and Jóhann Ísak |
Functions 2 |
|
Lesson 2
Odd and even functions. One - to - one and onto functions.
Below are the graphs of the functions f(x) and g(x).
|
|
|
The Domain of the function f(x) (Df)
is the set of x values and the range (Rf)
is the set of y values. On the graph to the left
Df
= [1, 5] and Rf
= [2, 4] .
On the graph to the right Dg
= [1, 3] and Rg
= [1, 4].
The graph of f(x) rises continually as we
move from left to right and is called an increasing function.
On the other hand the graph of g(x) goes continually down as we move from left
to right and is called a decreasing function.
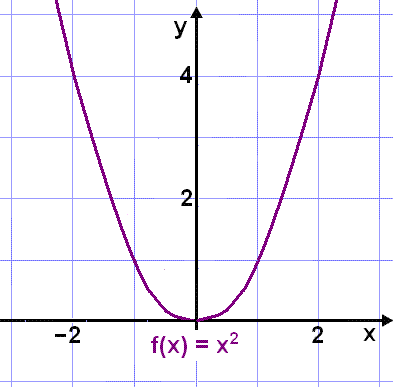
Some functions are increasing on one interval and decreasing on another. The function f(x) = x2 shown in the graph below is decreasing on the interval á¬,0] but increasing on [0,®ñ.
The function f(x) = x2
The function f(x) = x2 is symmetrical about the y axis, the y axis acts as a mirror reflecting the graph. The y axis, ( x = 0 ) is the axis of symmetry of the function. Functions that are symmetrical about the y axis are called even functions.
It's usually simple to see from the graph if a
function is an even function . We can prove it algebraically by
comparing f(a) and f(–a).
If f(–a) = f(a) then f(x) is an even function.
Example 1
Is
an even function?.
The calculator shows a graph that seems to be even.
 |
To prove it we calculate f( -a )
This means that f(x) is an even function.
Example 2
Is f(x) = 8(ex – x – 1) an even function?
The calculator shows a graph that looks a bit like a parabola.
 |
Now we'll do the algebra:
f(–a) = 8(e–a + a – 1)
f(a) = 8(ea – a – 1)
These are not the same and therefore the function is not even.
A second type of symmetry is symmetry about the origin. A graph that is the same after we have turned it through 180° about the point (0, 0) is symmetrical about the origin. ( you can see this by turning the graph upside down ). A function with this property is called an odd function. An example of an odd function is f(x) = x3.
 |
The arrows show that when the graph of f(x) = x3 is turned half a circle about the origin it falls exactly over the original graph. To show that a function is odd we have to show that f(–a) = –f(a).
Example 3
Is
an odd function?
The calculator shows a graph that seems to be symmetrical about the origin.
 |
To prove it we compare f( a ) and f( -a )
We see that f(–a) = –f(a) so f(x) is an odd function.
If we translate an even
function we get a function that is symmetrical about a vertical line. We can see
this if we think about the graph of a parabolic function , it always has a
vertical axis of symmetry.
If we can write a function in the form f(x–a) + b where f(x) is an even
function then x = a is the axis of symmetry of the function.
If we translate an odd
function then we get a function that is symmetrical about a point.
If we can write a function in the form f(x–a) + b where f(x) is an odd
function then the graph of y = f(x–a) + b is symmetrical about the point (a, b).
Example 4
Is the graph of ![]() symmetrical about a
point or about a vertical line?
symmetrical about a
point or about a vertical line?
The calculator shows a graph that seems to be symmetrical about a vertical line near to x = –1.
 |
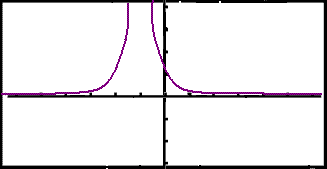 |
We can rewrite the function as follows:

The function is obviously a
translation of the function ![]() by one unit to the left. Now check whether g(x) is an even function.
by one unit to the left. Now check whether g(x) is an even function.
![]()
So g(x) is an even
function and f(x) is found by translating g(x) by one unit to the left.
We conclude that
f(x) has an axis of symmetry
with the equation x = –1.
Example 5
Is the function ![]() symmetrical about a line or a point?
symmetrical about a line or a point?
The graph seems to suggest it is symmetrical about a point.
 |
 |
The function
![]() is a translation
of the function
is a translation
of the function ![]() by one
unit to the right.
by one
unit to the right.
Now we'll check that g(x) is an odd function.
![]()
We conclude that g(x) is an odd function and f(x) is found by translating g(x) one unit to the right. So f(x) is symmetrical about the point (1, 0).
If we have a function, say f, defined on a set, say R such that the function takes every value in the set R, then the function f is called a surjection. It's more common to say that the function is " onto". If there are values in the set R that the function f does not take then f is not a surjection and the word "into" is commonly used.
Example
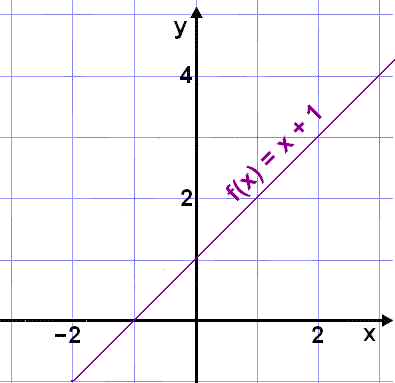
The function y = f(x) = x + 1 defined on R has a straight line graph as the diagram shows. Whatever value of y we choose, we can always find an x that maps onto the y we have chosen. So the function f(x) defined on R is a surjection. We say that it is a mapping from R onto R.
|
|
 |
|
| x | F(x) | |
| -2 | -1 | |
| -1 | 0 | |
| 0 | 1 | |
| 1 | 2 | |
| 2 | 3 | |
| 3 | 4 | |
| 4 | 5 | |
| 5 | 6 | |
| Every number in R can be found in this column | ||
An example of a function that is not "onto" R is f(x) = x2. The table of values show that no negative values appear in the y column.
|
|
 |
|
| X | f(x) | |
| -2 | 4 | |
| -1 | 1 | |
| 0 | 0 | |
| 1 | 1 | |
| 2 | 4 | |
|
there can be no negative numbers in this column |
||
If, however we limit ourselves to positive real numbers R+ then we can find an x corresponding to every y value in R+ so g(x) = x2 is a mapping from R+ onto R+ and g(x) is therefore "onto" R+ .
The diagram below shows a function f mapping values from the domain A onto the codomain B. If the function f is a surjection ( onto ) then every element in the set B is a mapping of some element from the set A. In other words the range of the function is the same as the chosen codomain.
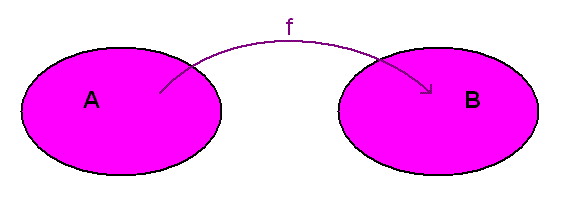
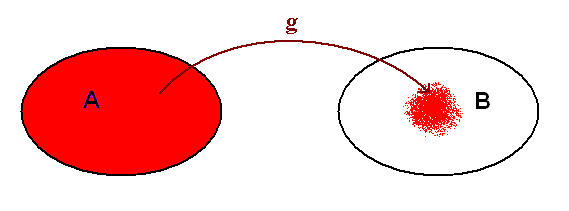
The next diagram shows shows a function g that maps the elements of the domain A onto just a small part of the codomain B. The shaded area of B shows the range of the function . It's only a part of B. In other words there are elements in B that are not used by g and g is therefore not a mapping from A onto B but a mapping from A into B. So g is not a surjection.
We are now going to look at another property of functions. This is a property called one - to - one. It means that different x values always map onto different y values. In other words if we make a table of values for the function then the same y value never appears more than once in the table. The formal definition is as follows:
|
A
function
f is one - to - one |
If a function is continuous and one - to - one then it is either always increasing or always decreasing. An easy way to see this on a graph is to draw a horizontal line through the graph . If the line only cuts the curve once then the function is one - to - one. This must of course apply to all horizontal lines that can be drawn through the graph.
Example 6
Is the function ![]() with the domain
á–2,®ñ
one - to - one?
with the domain
á–2,®ñ
one - to - one?
If the function is
one - to - one the equation
![]() is only true if x1 = x2. This is obviously the case
so f(x) is one - to - one.
is only true if x1 = x2. This is obviously the case
so f(x) is one - to - one.
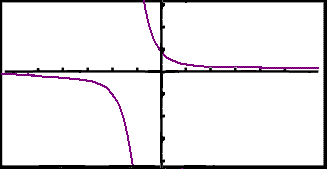
The graph is shown below and it is easily seen that a horizontal line will only cut the curve once. This applies to more than just the interval á–2,®ñ .
 |
 |
Example 7
Are the functions f(x) = x2 and g(x) = x3 defined on R one - to - one?
f(–1) = (–1)2 = 1 = f(1). There are two values of x that give the y value 1 so the function is not one - to - one. f(x) is a parabola and a horizontal line can cut it twice.
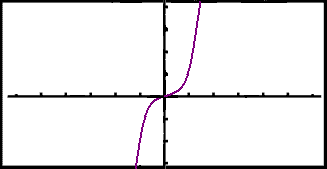
g(x) = x3 is one - to - one because x13 = x23 means that x1 = x2 . The graph is shown below and it can easily be seen that a horizontal line only cuts the curve once
 |
 |
Functions that are both one to one and onto are called bijections
The function g(x) = x3 in example 7 is both one - to - one and onto. y values go from y = –∞ to y = ∞ and the function is increasing on all it's domain.
Practise these methods and then
take test 2 in functions 2.
ps. Remember the check list!