| © 2008 Rasmus ehf and Jóhann Ísak | Equations III |
|
Lesson 3 Intersection points of graphs
How do we set about finding the points in which two graphs y = f(x) and y = g(x) intersect?
We already know how to find where the graph of
f(x) cuts the x−axis. That’s where y = 0. We calculate it by solving the
equation f(x) = 0 .
When the graphs of y = f(x) and y =
g(x) intersect , both graphs have
exactly the same x and y values. So we can find the point or points of
intersection by solving the equation f(x)
= g(x). The solution of this equation will give us the x value(s) of the
point(s) of intersection. We can then find the y value by putting the value for
x that we have found into one of the original equations. That is by calculating
either f(x) or g(x).
Example 1
Calculate the point of intersection of the two lines f(x) = 2x − 1 and g(x) = x + 1. First let’s look at a graph of the two functions. We can see the point of intersection is (2, 3).
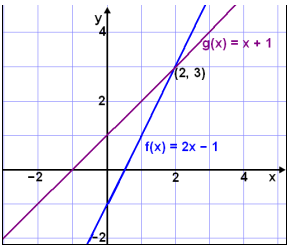
We calculate the point of intersection by solving the equation f(x) = g(x). That is:
2x − 1 = x + 1
2x − x = 1 + 1
x = 2
The y coordinate can now be found by calculating f(2):
f(2) = 2×2 − 1 = 3
The point of intersection is (2, 3).
The example shows that we can find the point
of intersection in two ways.
Either graphically, by drawing the two graphs in the same coordinate system, or
algebraically by solving the equation such as the one in the above example.
Example 2
Solve the equation x2 − 2x − 3 = 2x − 3 first graphically, then algebraically.
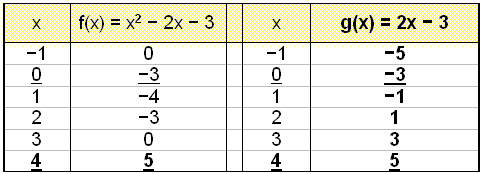
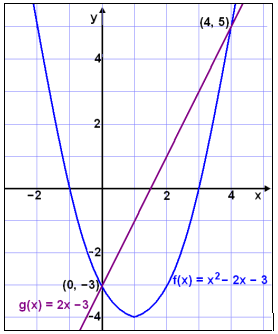
We draw the graphs of f(x) = x2 − 2x − 3 and g(x) = 2x − 3 by making a table of values and plotting the points. We can see, both from the graph and from the table of values, that the graphs intersect when x = 0 and x = 4.
Solving algebraically:
x2 − 2x − 3 = 2x − 3
x2 − 4x = 0
x(x − 4) = 0
Giving the solutions x = 0 and x = 4.
Example 3
Solve the equation x2 − 1 = 2x − 3
First move all the terms over to the left hand side of the equation and simplify.
This gives x2 − 2x + 2 = 0
We use the quadratic formula with a = 1, b = −2 and c = 2.
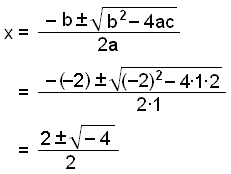
The number under the square root sign is
negative which means this equation has no solution.
To see why this is we draw the graphs of the left hand side of the original
equation
f(x) = x2 − 1 and the right hand side g(x) = 2x − 3.
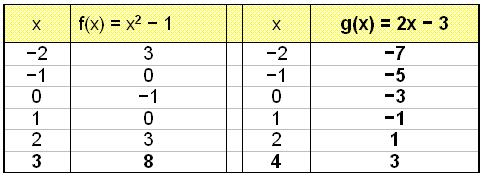
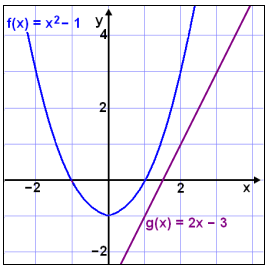
We see that the parabola f(x) and the straight line g(x) do not intersect. It’s easy to see that we cannot calculate the point of intrsection simply because there is no such point.
Example 4
Solve the equation x3 − 3x + 2 = x2 − 2x + 1
As in the previous example we move all the terms over to the left hand side of the equation.
x3 − 3x + 2 = x2 − 2x + 1
x3 − x2 − x + 1 = 0
(x3 − x2) − (x − 1) = 0
x2(x − 1) − (x − 1) = 0
(x − 1)(x2 − 1) = 0
(x − 1)(x − 1)(x + 1) = 0
Calculations show that there are only two solutions, x = 1 and x = −1, but a cubic equation can have three solutions. The graph shows us what is happening.
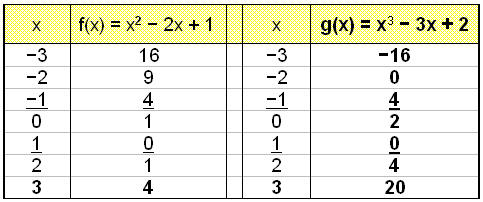
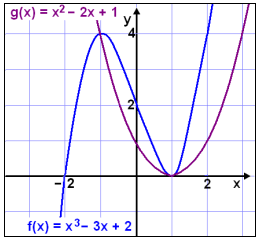
The graphs of f(x) = x2 − 2x + 1 and g(x) = x3 − 3x + 2 intersect in only two places, where x = −1 and x = 1 which were the solutions of the equation.
Example 5
Solve the equation x2 = ![]() x
x
It’s easy to see that x = 0 and x = 1 are solutions of the equation but are there any more solutions?It’s not very likely but let’s look at the graphs.
Call the left hand side f(x) = x2 and the right hand side g(x) = ![]() x.
Remember that g(x) can’t take negative values of x so there can’t be any
negative points of intersection.
x.
Remember that g(x) can’t take negative values of x so there can’t be any
negative points of intersection.

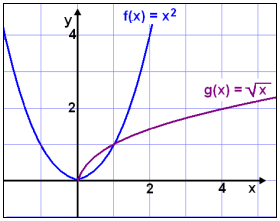
The graph shows that there are only two points
of intersection and therefore only two solutions to the equation. x = 0 and x =
1.
Here’s how to solve the eqaution by calculation:
| x2 = x4 = x x4 − x = 0 x(x3 − 1) = 0 |
Square both sides of the equation to get rid of the square root. |
This gives the solution x = 0 and x = 1.
Example 6
Solve the equation ln x = x2 − 1
This equaton is not so easy to solve. If we remember the definition of a logarithm we can see that x = 1 makes both sides of the equation equal to 0 and is therefoer one solution to the equation. We draw graphs to see if there are any other solutions .

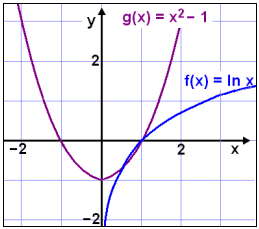
The graph shows us that there are two solutions. One solution is exactly x = 1 because e0 =1.
Notice that we choose the x values so that the y values become nearer and nearer to each other in the table of values. In this way we can choose the x value to get the accuracy we want.| Example 7 |  |
EXCEL |
If we use a graphical calculator we can find the solution of the equation ln x = x2 − 1 much more easily.
We draw the graphs of both sides of the equation and use Zoom (shift F2) and then „Trace (shift F1)“ to find the point of intersection.
Even easier is to use the G-Solve ( F5) and then the intersection function ISCT (F5) . This gives us the first point of intersection. We then press the right arrow and the calculator will move on to the second intersection point.
The spread sheet program EXCEL has a tool called “goal seek” to solve equations that can’t easily be solved algebraically.
Start by rearranging the equation as shown.
ln x = x2 − 1
1 = x2 − ln x
Open EXCEL and begin by choosing or guessing a
starting value for x. Enter this into cell B2. We can, for example choose 0.1.
Next we put the formula that we have on the right hand side of the equation, x2 − ln x , into cell D2 .
The formula will look like this:
= B2^2−ln(B2)
Now choose “Tools“ and then “Goal Seek“ on the menu bar. The following appears on the screen:
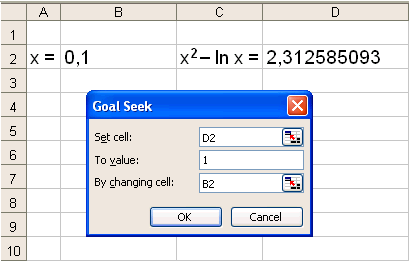
We write D2, 1 and B2 in the spaces as shown. We are asking Excel to make make the value of cell D2 equal to the value 1 by changing the value in B2.
When we click on OK the following information appears.
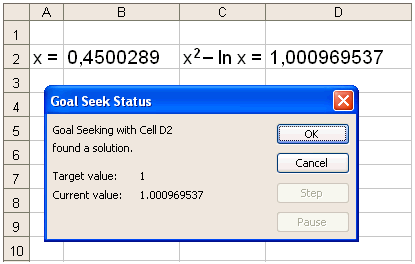
This tells us that the approximation x ≈ 0.45 that we found graphically in example 6 is pretty good.The solution x ≈ 0.4500289 found by using EXCEL is not much better.
Try Quiz 3 on Equations III.
Remember to use the checklist to keep track of your work.