© 2009 Rasmus ehf & Jóhann Ísak
|
© 2009 Rasmus ehf & Jóhann Ísak |
Derivatives |
|
Lesson
1
Rate of change and gradients.
We now look at lines that are chords and tangents.
A line that just touches a curve in one point is called a tangent. We measure the slope of the curve in that point by measuring the slope of the tangent.
A line that cuts the curve in two points is called a chord. Look at the following diagram.
First consider what is meant by "rate of change"
and " average rate of change". Rate of change is the rate of change at one
particular point in time whereas average rate of change is the rate of
change measured over a given interval.
Consider the speed of a car. There is a difference between the speed shown on
the speedometer at any particular point and the average speed measured over a
given distance.
Example 1
The following table shows the reation between time and the temperature of water in a saucepan when it is heated from 20°C to boiling point.
|
Time ( min. ) |
Temperature |
| 0 |
20°C |
| 1 |
30°C |
| 2 | 40°C |
| 3 | 49°C |
| 4 | 58°C |
| 5 | 66°C |
| 6 | 74°C |
| 7 | 81°C |
| 8 | 88°C |
| 9 | 95°C |
| 10 | 100°C |
At what rate does the temperature rise?
There are many ways of looking at this equaetion. We can for example measure the average rise in temperature per minute as the water boils.
The temperature rises by 80°C in 10 minutes so the average rise in temperature is 80/10 = 8°C/min.
If, however, we look at the table of values we see that the temperature rises more slowly as the water gets hotter. We can therefore get a more accurate picture of what is happening by looking at the average temperature rise in the first two minutes and the last two minutes.
The average rate of change in the first two minutes is (40 20)/(2 0) = 20/2 = 10°C/min.
The average rate of change in the last two minutes is (100 88)/(10 8) = 12/2 = 6°C/min.
Example 2
Now we will apply these ideas to functions.
Look at the function f(x) = ¼x2 and consider the rate of change of the value of the function as x increases. Imagine the x values are measured in minutes. We get the following table of values:
|
x ( min. ) |
f(x) = ¼x2 |
| 0 |
0 |
| 1 |
¼ |
| 2 | 1 |
| 3 | 2¼ |
| 4 | 4 |
| 5 | 6¼ |
| 6 | 9 |
| 7 | 12¼ |
| 8 | 16 |
Average rate of change of the function:
Over the whole interval = (16 0)/8 = 2
Over the first two minutes = (1 0)/2 = ½
Over the last two minutes = (16 9)/(8 6) = 7/2 = 3½
Over a middle two minute interval, for example 3 to 5 minutes = (6¼ 2¼)/(5 3) = 2
The following is a formula for the average rate of change of the function f(x) from x1 to x2 :
Average rate of change
=

If we use y instead of f(x) which is, of course, the same value we can write the formula for the average rate of change as:
Average
rate of change =
![]()
This is exactly the same formula that we use to find the gradient (slope) of a straight line and in fact, the average rate of change between two points is simply the gradient of the straight line joining these two points on the graph, that is the gradient of the chord joining these two points.
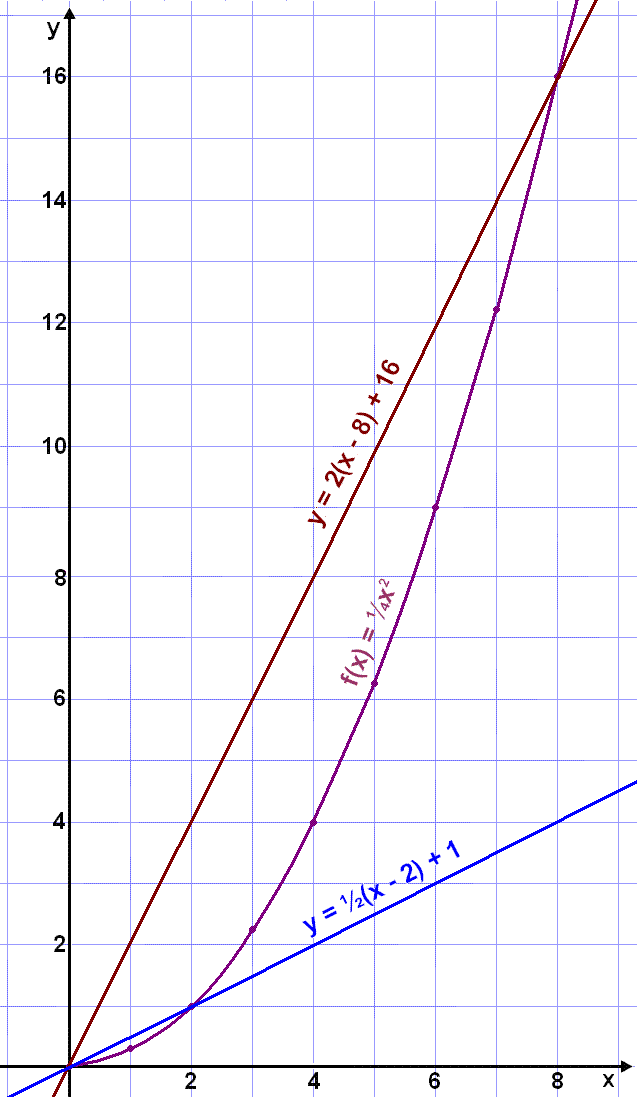
The graph below shows two chords of the graph of
the function
f(x) = ¼x2 .
The slope of the first chord is the average
rate of change for the whole interval from 0 to 8, and the slope of the second
chord is the rate of change for the first two minutes. The equation of the
chord is found using the average rate of change as the gradient and then
choosing a fixed point from the table of values.
This information is then put
into the equation for a straight line y = k(x x1) + y1.
|
The average rate of
change on the interval
x1
|
Example 3
Find the average rate of
change of the function f(x) = x3
on the interval
2
![]() x
x
![]() 2.
2.
First we find the two points.
x1 = 2 and f(2) = (2)3 = 8
x2 = 2 and f(2) = 23 = 8
The Average rate of change is
![]()
Example 4
Lets look again at the function f(x) = ¼x2 and find the average rate of change when x is near to the value 4 (x = 4). First we'll start to the left of 4 and consider smaller and smaller intervals. We use the table of values in example 2.
Average rate of change on the interval 1
![]() x
x
![]() 4 is (4 ¼)/(4 1) = 1¼
4 is (4 ¼)/(4 1) = 1¼
Average
rate of change on the interval
2
![]() x
x
![]() 4 is (4 1)/(4 2) = 1½
4 is (4 1)/(4 2) = 1½
Average
rate of change on the interval
3
![]() x
x
![]() 4 is (4 2¼)/(4 3) = 1¾
4 is (4 2¼)/(4 3) = 1¾
The chords corresponding to these calculations are shown in the graph below.
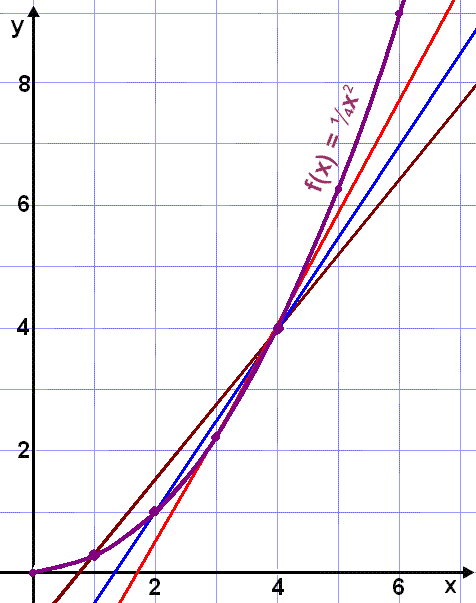
We get a "fan" of chords, the gradients getting bigger and bigger as the first point gets nearer to 4 so that the interval gets smaller.
Now lets do the same thing from the right of x = 4.
Average rate of change on the interval
4
![]() x
x
![]() 7 is ( 12¼ 4)/(7 4) = 2¾
7 is ( 12¼ 4)/(7 4) = 2¾
Average rate of change on the interval
4
![]() x
x
![]() 6 is (9 4)/(6 4) = 2½
6 is (9 4)/(6 4) = 2½
Average
rate of change on the interval
4
![]() x
x
![]() 5 is (6¼ 4)/(6 5) = 2¼
5 is (6¼ 4)/(6 5) = 2¼
We can conclude from these calculations that the average rate of change of the function near to x= 4 is somewhere between 1¾ and 2¼.
Example 5
We
can calculate the
average
rate of change on as small an interval as we wish. We'll continue using the
function f(x) = ¼x2
and choose a tiny interval around x
= 4.
We do this by choosing a point at a distance h from 4 .
This gives us the two points x = 4 and 4 + h so that we can calculate the
average rate of change on an interval of length h.
The diagram below
shows the two points we have chosen and the chord joining them.
The points are
(4,
4) and (4+h, f(4+h)).
We need to calculate f(4+h) = ¼(4 + h)2 = ¼(16 + 8h + h2) = 4 + 2h + ¼ h2.
The chord goes through the two points (4, 4) and (4+h, 4+2h+¼h2) so the average rate of change or gradient of the chord is
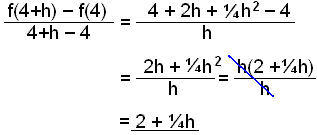
If we choose values of h getting smaller and smaller we get the following results for the average rate of change:
h = 0.04 gives us 2 + ¼·0.04 = 2.01.
h = 0.0004 gives us 2 + ¼·0.0004 = 2.0001.
As the value of h gets smaller, that is the interval around 4 gets smaller, we see that the average rate of change gets nearer and nearer to 2.
and finally as h gets to
zero we get
![]()
This limit gives us the rate of change in the point (4, 4). The line we draw is no longer a chord but has become a tangent to the graph in the point (4, 4). The gradient of the tangent is the rate of change of the function in that point.
We can find the equation of this tangent using the formula y = k(x x1) + y1.
y = 2(x 4) + 4 = 2x 8 + 4 = 2x 4
y = 2x 4
|
The gradient of a tangent to f(x) in the point (a, b) is
The equation of the tangent in the same point (a, b)is y = k(x a) + b
|
Example 6
Find the equation of the tangent to the graph of f(x) = x2 2x + 1 in the point (2, 1).
First we find the gradient.
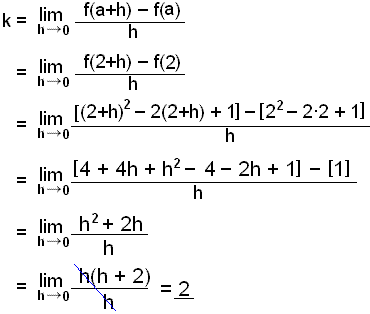 |
The square brackets are used to make it
easier to distinguish between
f(2+h) and f(2).
|
The equation of the tangent is therefore:
y = 2(x 2) + 1
= 2x 4 + 1
y = 2x 3
Now we will see how we can use the CASIO-calculator to check our result.
 |
 |
The equations for the function and the tangent are entered.
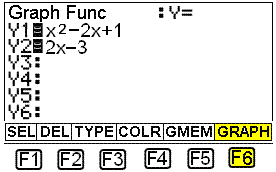
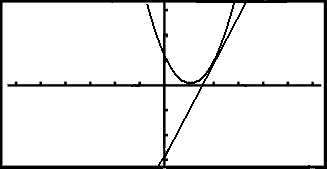
We get the following graphs which show us that the line we have calculated touches the graph in one point and is therefore a tangent.:
It's also possible to use the calculator to find the gradient.
Choose the RUN menu then press the OPTN button on the keyboard ( next to the SHIFT key)
|
|
 |
|
 |
||
Next choose CALC using F4 and d/dx using F2. (d/dx is a symbol for the slope of a tangent. It will be explained later). Next enter the equation of the function and the x value of the point in which the slope is to be found ( see below)

The result is 2 which also verifies our calculations.
Practise these methods and then
take test 1 on differentials.
ps. Remember your check list.