Integration
| © 2010 Rasmus ehf and Jσhann Νsak |
Integration |
|
Lesson 2
Integrals
Integration is a tool used in many sciences. To integrate means to collect together and form a whole. In mathematics integration is used, amongst other calculations, to find the area bounded by the graph of one or more functions.
Example 1
Find the area bounded by the x axis and the graph of the parabola f(x) = x2 + 5x 4.
To do this we divide the area up into rectangular strips, find the area of each
one
and add them together.
. 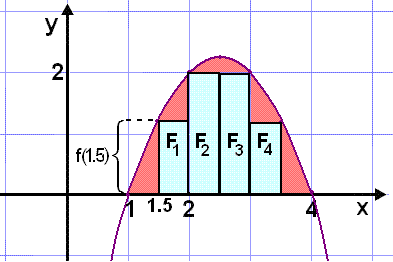
The blue strips are each 0.5 units wide, the height being determined by the function.
The first rectangle goes from x = 1.5 to x = 2.
The height of the rectangle is f(1.5) = 1.52 + 5·1.5 4 = 1.25
and the area is F1 = 1.25·0.5 = 0.625.
The next rectangle starts in x = 2.
The height is f(2) = 22 + 5·2 4 = 2.
and the area is F2 = 2·0.5 = 1.
In the same way we can find the area of the other rectangles, F3 = 1 and F4 = 0.625
The total area of the rectangles is therefore 0.625 + 1 + 1 + 0.625 = 3.325.
We can see that this value for the area is too small, the red coloured area is missing. We can improve our estimate by making the strips narrower. The following table shows the calculations for strips of width 0.25 units.
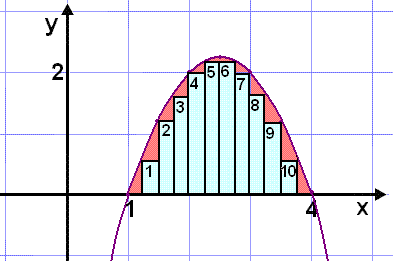 |
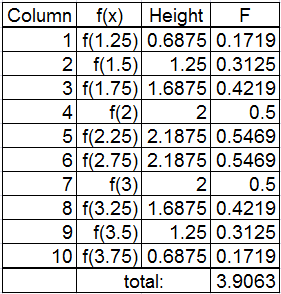 |
| Excel is a very useful tool for doing these type of calculations as the table to the right shows. |
In this case the total area of the rectangles is 3.9063 units which is obviously a much closer estimate of the area than our first attempt though it is still too small.
We can carry on in this way getting nearer and nearer to the correct answer. This sum of the area of the rectangles that always lie under the graph is called a Lower Sum.
Example 2
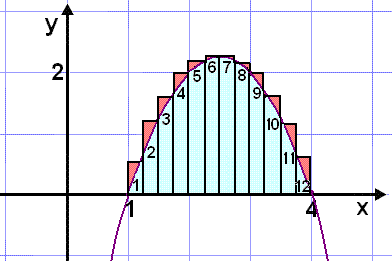
Find the area between the x - axis and the graph of the parabola f(x) = x2 + 5x 4. To do this we divide the area into vertical strips with heights equal to the greatest value of the function in each interval. We then calculate the total area of the columns. This gives us an area that is larger than the area under the graph as the red shaded area shows.
 |
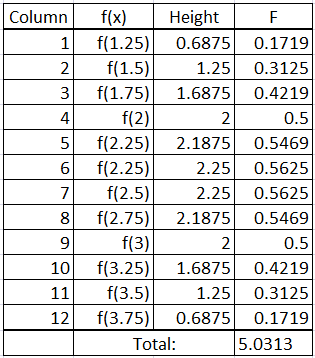 |
The f(x) column shows which value of the function is used to calculate the height of the corresponding strip which each are 0.25 units wide . The resulting area is 5.0313 which is quite a lot higher than the number found in example 1, an obvious result as in this case the columns are all higher than in the previous example.
The narrower we make the strips the nearer we get to the correct area. The method used in example 2 is called finding the Upper sum.
We can also get a better approximation by finding the average of the Upper sum and Lower sum. In this case the area is then
Area F ≈ (3.9063 + 5.0313)/2 ≈ 4.469
Somewhere between the upper sum and lower sum must be the exact size of the area we are trying to find between the x axis and the graph of f(x) = x2 + 5x 4.
Now we will look at how to calculate the areal exactly and the connection between integration and area.
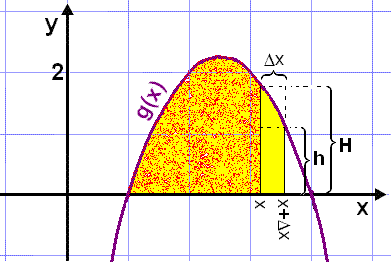
The diagram shows vertical lines of height h and H at positions x and x+Dx
(read delta x). The interval between these two lines has a width of
Dx,
a symbol frequently used to show the length of a very small interval on the x
axis. If we call the area of the yellow spotted part of the diagram F(x) then
the total area of all the shaded part is
F(x+Dx).
The area of the yellow
shaded part alone is the difference between these two, that is
The area of the one colour yellow part is F(x+Dx) F(x).
The area of the upper rectangle for this part is H·Dx.
The area of the lower rectangle for this is h·Dx.
We can now write the following inequality for the area of the yellow part of the graph:
h·Dx ≤ F(x+Dx) F(x) ≤ H·Dx
Dividing through by Dx.
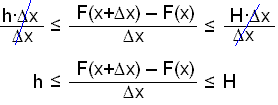
But H = g(x) and h = g(x+Dx) so the inequality can be written:
![]()
Using the sandwich rule
and taking the limit as
Dx
goes to 0 gives us the result
![]()
This reminds us of the definition of derivatives
f '(x) =
![]()
where h is exactly the same interval as Dx, in fact in many texts Dx is used instead of h in the definition of a derivative.
We can therefore deduce that F΄(x) = g(x) so g(x) is in fact the derivative of the area function In other words we can find area by integrating the function bounding the area. The only difference between the two is a constant that we lose when we differentiate. When calculating area using integrals we first calculate the area using the upper limit and then subtract the area found using the lower limit. When we do this the constant disappears as it is first added in and then subtracted again. The following notation is used:
|
The area between a positive function g(x) and the x - axis on the interval from a to b is called the definite integral of the function and is written:
where G(x) is the function for which G '(x) = g(x)
The indefinite
integral is defined without the limits:
|
Note that the symbol for integration looks like an elongated s , (![]() ) The fact that it looks like an S reminds us that we are
finding sums. Two numbers are written at each end of this symbol. The lower number
or lower bound shows
the x value where the area begins and the upper number or upper
bound where it ends.
The formula for the function is written after the integral symbol followed by a
"dx" which symbolises the fact that the width of the column is a very
small interval of the
x - axis. If we put all this together for the examples 1 and 2 we get:
) The fact that it looks like an S reminds us that we are
finding sums. Two numbers are written at each end of this symbol. The lower number
or lower bound shows
the x value where the area begins and the upper number or upper
bound where it ends.
The formula for the function is written after the integral symbol followed by a
"dx" which symbolises the fact that the width of the column is a very
small interval of the
x - axis. If we put all this together for the examples 1 and 2 we get:

This definite integral, F, gives us the area between the function x2 + 5x 4, the x axis and the x values 1 and 4 .
Example 3
Calculators find the definite integral in a similar way as in the above examples, except that they mostly use trapezes instead of rectangles to approximate the area. The diagram below shows that trapezes give a much more accurate estimate, the red shaded area in the diagram is much smaller than when rectangles are used.
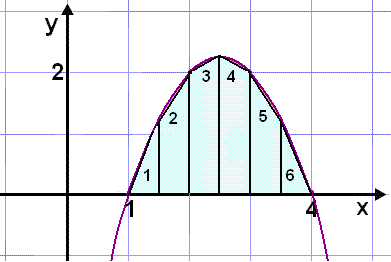
The area of a trapeze is the average of the two parallel sides (a+b)/2 multiplied by the distance between them, g. For example the area of the trapeze labelled 2 in the diagram is
A = g·(a+b)/2
= 0.5·(f(1.5) + f(2))/2
= 0.5·(1.25 + 2)/2
= 0.8125
Now let's use Excel to find the area of all the six trapezes and add them together.
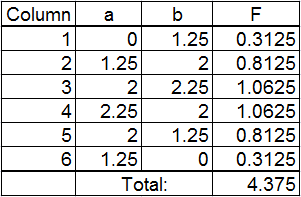
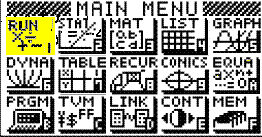
This method gives quite accurate results even with few columns, and therefore convenient for calculators. The following shows how it's done using a CASIO-calculator.
 |
 |
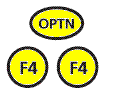 |
Choose run from the menu RUN then press the OPTN-button next to the SHIFT. Now choose CALC with F4 and ς dx with F4 again. The following appears on the screen: ς ( . The function is now written in followed by a comma, then lower and upper limits in this case 1 and 4 with a comma between them . We can add another number to say how many strips we wish to divide the area into but it's best to leave that to the calculator. Finally the bracket is closed and the EXE button pushed. This is the result:

Example 4
Now we can use definite integrals to find the exact area between the graph of the parabola f(x) = x2 + 5x 4 and the x-axis.
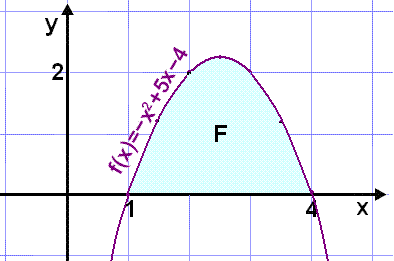
We find the definite integral of f(x) on the interval 1 ≤ x ≤ 4. First find the integrand.
|
|
We use the rule |
Then put in the upper and lower limits.
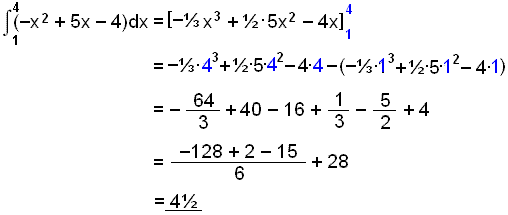
This is the same result as the calculator gave.
Example 5
Find the area between the x-axis and the line y = 2x 2 for 0 ≤ x ≤ 3.
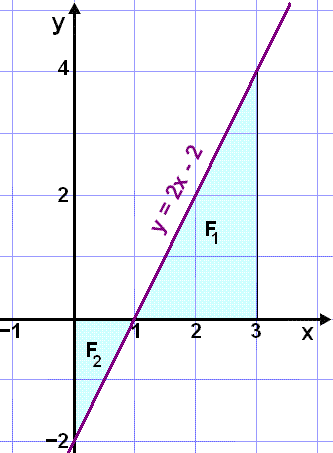
Integrating we get :
![]()
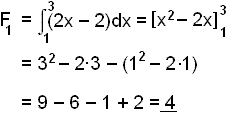
In this example the function is both above and below the x axis so we work in two parts.
1) Find the area marked F1 on the diagram.
2) Next find F2.
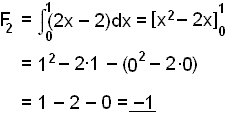
When we integrate a function that lies under the x-axis we get a negative answer. Area is always positive so we forget about the minus sign and add the two positive numbers together to get the area of 5 units.
3) If we simply integrate this function between 0 and 3 without thinking of it as area we would get:
![]()
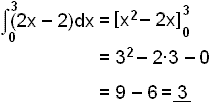
Which is 4 1 = 3, the sum of the two answers in the previous examples
4) Now see what happens if we reverse the limits.
Calculate
![]()
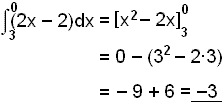
So we see that reversing the limits changes the sign of the result.
|
Integrating a function that lies under the x axis gives the negative value of the area. Therefore, when using integrals to find area it's essential to check whether the function is above or below the axis or whether it crosses the x axis at some point within the interval being considered. The following rule also holds when the limits are reversed:
|
Example 6
Find the area between the x axis and the graph of the sine function on the interval from 0 to p.
It's useful to use the graphical calculator to get some idea of what the function looks like.
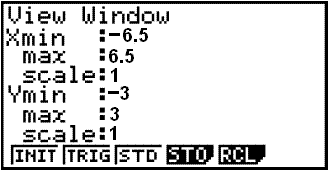
On the menu choose GRAPH and the screen values (with V-Window). The following units will do. ( Make sure that the angle is measured in radians ( set up)).
 |
 |
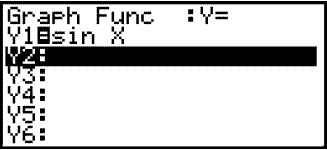
Enter the function and draw the graph.
 |
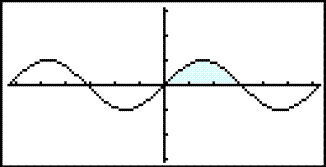 |
The blue area is what we are trying to find. We could let the calculator find it for us but need to practise using integrals.
First we integrate then put in the upper and lower bounds.
![]()

The area we are looking for us therefore 2 units
Example 7
Find the area between the x-axis and the graph of the cosine function on the interval 0 to p.
Graphing shows us that the graph is both above and below the x axis
 |
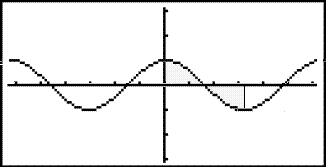 |
This means we have to do
our calculations in two parts. The graph crosses the x- axis in
x =
![]() (cos
(cos ![]() = 0) so we first integrate from 0 to
= 0) so we first integrate from 0 to ![]() and then from
and then from ![]() to
to ![]() .
.
Integrating
![]()
Put in the upper and lower bounds


The second answer is negative as we expected so we forget about the negative and add two positive numbers together getting the answer 2 , the same area as in the previous example.
Example 8
Find the area enclosed between the x-axis and the graph of f(x) = x2 3x 4.
Using the calculator we see that the graph lies below the x - axis so we begin by finding where this happens ( by finding the roots of f(x) ).
x2 3x 4 = (x + 1)(x 4) = 0
The roots are x = 1 and x = 4.
The graph looks like this:
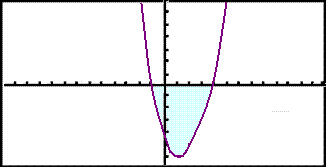
As the graph lies under the x axis we integrate the function using the bounds 1 and 4 and then leave out the negative.
Integrating:
![]() .
.
Putting in the upper and lower limits:
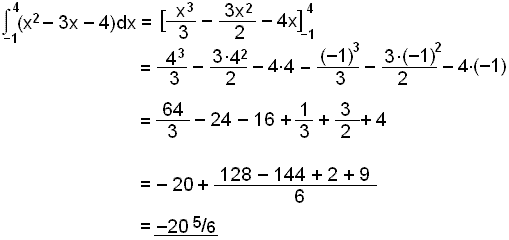
The area is therefore:
![]()
Practice these methods then take
test 1 on integration.
Remember the check list!!