Look at the diagram and
choose the correct answers.
1.
This
diagram is called a: 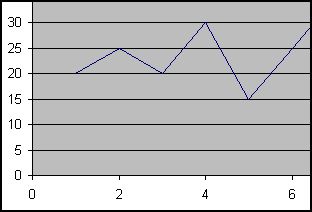
The diagram for questions 2 and 3
2.
This diagram shows the number of goals scored by
five players in a football match. Which players scored the same number of
goals in the match?
3.
What was the total
number of goals scored in the match according to the diagram in Example
2?
4.
This graph shows the amount of rainfall measured
during one week. On which day rained the most?
5. Which days
had the same rainfall?
6.
What was the total amount of
rainfall measured during the week?
7.
This graph shows the frequency of
SMS messages received by 5 mobile phone owners during one day. What was the
total number of SMS messages received by the 5 individuals that day?

8.
Jens kept a record of how many e-mail messages
he received during one week. The graph above shows the frequency of messages
received by Jens. How many messages did he receive on Wednesday and Thursday?
Number of cinema visits during the month
9. This graph shows the frequency of
cinema visits during one month. How many of the teenagers went to the
cinema more than once during the month?
10. What
is the total number of cinema visits made during the month by the 10 teenagers
shown in the graph?
Percentage of correct answers =
| Correct answers: |
Your answers: |
|
|