Ordered pairs
| © 2004 Rasmus ehf |
Ordered pairs |
Graphing with ordered pairs (coordinates)
Lesson 2.
Linear equations
Equations that have the form y = ax + b , where a and b are known values, are called linear equations because their coordinates lie on a straight line.At least 2 points are needed to draw a line. It is a good idea to plot at least 3 points when graphing a linear equation.
Table of values: If you have a linear equation with 2 variables you can make a table of values. Here is an example of a linear equation: y = x + 1 The relationship between the variables must remain the same, but you can choose the values for x and calculate the corresponding values for y .
Table of values for y = x + 1
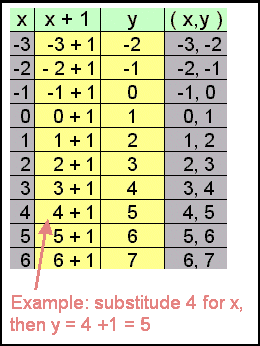
Note: You can decide how many
values you wish to calculate. But remember that you should always find values
for at least 3 points. If the 3 points don't lie on a straight line, you
have made a mistake in your calculations.
A graph for the equation: y = x + 1
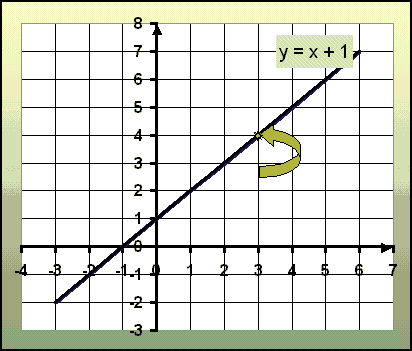
The arrow marks the point (3,4) which is one of the coordinates found in the table of values. Another point is (0,1), which is the point where the line crosses the Y axis. When you have plotted 2 points on a grid, you can join them to draw the graph of a linear equation.
Parabolas
An equation that has the form ![]()
where a and b are known values, is an equation for a parabola.
You need several points to draw the graph of a parabola.
Example: You are given the
equation ![]()
Calculate a few values of y for x between -5 and + 5.
Make a table of values (see above).
Table of values for
![]()
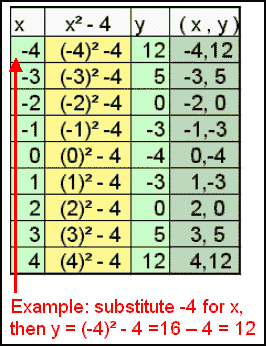
Notice that some of the values for y are
repeated. That is because the curve is symmetrical.
The graph for the parabola:
![]()
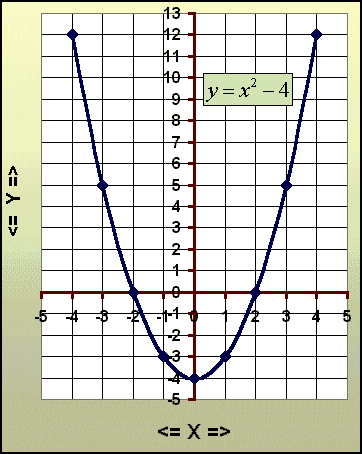
The graph is symmetrical, for example the point (4, 12) on the graph is reflected in the y axis (-4, 12). Notice where the curve crosses the y axis and the x axis.
If you factorise the equation ![]() ,
,
you get ![]() .
.
If you substitute 0 for y, you see that x must have the value of +2 or - 2 for the equation to be true. Therefore, the coordinates of the points on the y axis are (-2,0) and (+2,0).
Slope of linear equations:
Let's look at the line y = 2x + 1.
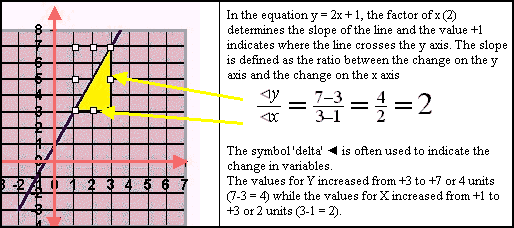
The slope of the line is 2 , which is the number multiplying the x . You can also calculate the slope by drawing a right-angled triangle as shown in the diagram and dividing the change in the y values by the change in the x values.
Try Quiz 2 on Graphing with ordered pairs.