Statistics
| © 2004 Rasmus ehf |
Statistics |
Lesson 4.
Bar graph, frequency distribution, sample, weighted average
Frequency distribution
Let's look at the weights of 30 pupils in the 10th grade. The weights (in kg) have been listed in order from the lightest to the heaviest.
50, 52, 54, 55, 57, 57, 58, 60, 60, 60, 61, 61, 62, 62, 63,
64, 65, 66, 66, 67, 67, 67, 67, 68, 70, 70, 71, 72, 73, 74
Values are often grouped into groups; in this case the groups have a range of 5 kg.
|
Set up a distribution table. |
|
| Weight in kg. | frequency |
| 50 - 54 | 3 |
| 55 - 59 | 4 |
| 60 - 64 | 9 |
| 65 - 69 | 8 |
| 70 - 74 | 6 |
Bar graph
|
|
|
This bar chart shows only part of the scale. Since no weights less than 50 kg were recorded, that part of the scale is not shown. A broken line is used to indicate this. A bar chart uses bars or columns to represent the values. It is important that all the bars have the same width. |
In the figure above we see that 3 pupils out of 30 have weights in the 50 to 54 kg category, which is 10% of the total group.
Sample
When we need to collect information about a large
population it is impractical to collect all the values. Instead we
choose a random sample and use statistical methods to draw conclusions
about the whole population.
For example, if
we want to find out how many 10th graders have access to the Internet in
Iceland, it would take a long time to ask every 10th grader in the country.
Instead, we randomly choose a sample of perhaps 100 pupils from 10th grade throughout
the country. The total number of 10th graders in Iceland is 4500. The sample for
the study would be 100 pupils; 50 boys and 50 girls.
These are the questions we asked:
Do you own a computer?
Do you have access to the Internet at home?
The results can be shown in a table.
| Questions and answers | Frequency (boys) | Frequency (girls) |
Total |
| Own a computer | 40 | 35 | 75 |
| Have access to the Internet at home | 45 | 40 | 85 |
| Do not have access to the Internet at home | 5 | 10 | 15 |
Since the total sample was 100, we can easily change the results into percentages.
We see that 85 or 85% of the pupils in the sample have access to the Internet at home. Based on this sample, we can predict the total number of 10th graders in the country who have access to the Internet. Calculating 85% of 4500 : 0.85 × 4500 = 3825. We can be fairly sure that approximately 3800 10th graders have access to the Internet at home.
Similar methods can be used to investigate many things.
For example:
voting trends
television viewing
newspaper reading
size of fish stocks
Weighted average
In Southvale school there are two 10th grade classes. Each class took a maths exam. The following results were recorded:
10th grade class A average score: 7.0 number of pupils: 20
10th grade class B average score: 6.0 number of pupils: 30
What is the average score for the school (both 10th grade classes together)?
It is not correct to add the average scores (7+ 6= 13) and divide by 2 (average = 6.5), because the 2 classes are not the same size.
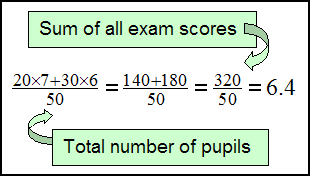
Instead we need to find the weighted average. To do this, add all the exam scores in both classes and divide by the total number of pupils.

The weighted average is found by adding all the scores and dividing by the total number of pupils. We see that the weighted average is 6.4, not 6.5.
Practice these methods and then try
Quiz 4 on Statistics.
Remember to use the Checklist to keep track of
your work.